Page 10 - INTERCARGO - Bulk Carrier Casualty Report 2022
P. 10

Summary


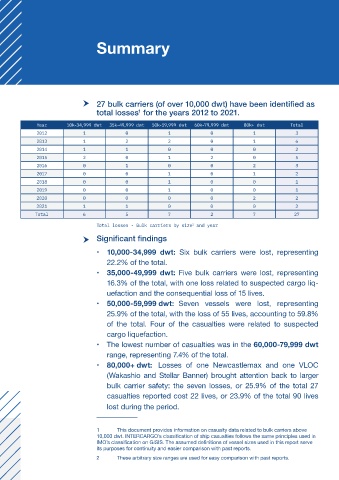
                                  27 bulk carriers (of over 10,000 dwt) have been identified as
                                   total losses  for the years 2012 to 2021.
                                                  1

              Year      10k-34,999 dwt  35k-49,999 dwt  50k-59,999 dwt  60k-79,999 dwt  80k+ dwt       Total
              2012            1              0              1              0              1              3
              2013            1              2              2              0              1              6
              2014            1              1              0              0              0              2
              2015            2              0              1              2              0              5
              2016            0              1              0              0              2              3
              2017            0              0              1              0              1              2
              2018            0              0              1              0              0              1
              2019            0              0              1              0              0              1
              2020            0              0              0              0              2              2
              2021            1              1              0              0              0              2
             Total            6              5              7              2              7             27

                                   Total losses - Bulk carriers by size  and year
                                                                     2
                                  Significant findings


                                   •  10,000-34,999 dwt:  Six  bulk  carriers  were  lost,  representing
                                       22.2% of the total.
                                   •  35,000-49,999  dwt:  Five  bulk carriers  were  lost,  representing

                                       16.3% of the total, with one loss related to suspected cargo liq-
                                       uefaction and the consequential loss of 15 lives.
                                   •  50,000-59,999 dwt:  Seven  vessels  were  lost,  representing
                                       25.9% of the total, with the loss of 55 lives, accounting to 59.8%
                                       of the total. Four of the casualties were related to suspected

                                       cargo liquefaction.
                                   •  The lowest number of casualties was in the 60,000-79,999 dwt
                                       range, representing 7.4% of the total.

                                   •  80,000+ dwt:   Losses  of  one  Newcastlemax  and  one  VLOC
                                       (Wakashio  and  Stellar  Banner)  brought  attention  back  to  larger
                                       bulk  carrier  safety:  the  seven  losses,  or  25.9%  of  the  total  27
                                       casualties reported cost 22 lives, or 23.9% of the total 90 lives

                                       lost during the period.


                                   1      This document provides information on casualty data related to bulk carriers above
                                   10,000 dwt. INTERCARGO’s classification of ship casualties follows the same principles used in
                                   IMO’s classification on GISIS. The assumed definitions of vessel sizes used in this report serve
                                   its purposes for continuity and easier comparison with past reports.
                                   2      These arbitrary size ranges are used for easy comparison with past reports.
   5   6   7   8   9   10   11   12   13   14   15